If you like our site, mark us as a preferred source on Google — so you’ll see our articles more often in search!
★Mark us as a preferred sourceThe 192-page deep-dive published in 2026 by the Institute for Governance & Sustainable Development (IGSD) and Gateway Research is not a conventional country study. It is not about improving waste management; it is about the fact that India’s landfills now constitute one of the world’s largest — and least monitored — methane sources, and that dismantling this problem is an institutional rather than a technological question. The report models four scenarios out to 2047, and its central conclusion will feel uncomfortably familiar to the European professional community: partial solutions are not merely slower, they are structurally incapable of reaching the target.
The numbers that don’t add up
Municipal Solid Waste Management in India: Policy and Technology Pathways for Climate Action is authored by Saloni Srivastava, Pranjali Chowdhary and Rishi Bakshi, supported by a twelve-member Indian expert advisory panel (TERI, NIUA, Centre for Science and Environment, Saahas Zero Waste, RAMKY Enviro) with contributions from IORA Ecological Solutions. IGSD has specialised since 2003 in the rapid mitigation of non-CO₂ climate pollutants — methane, black carbon and HFCs — and the report’s framing follows accordingly: the lens is not the intrinsic value of waste management but the cost-effectiveness of reducing short-lived climate pollutants (SLCPs).
The baseline dataset is instructive in itself. India generates 170,939 tonnes of municipal solid waste (MSW) per day — roughly 62 million tonnes annually. According to the CPCB’s 2022–23 annual report, this breaks down as follows:
| Flow | Quantity | Share |
|---|---|---|
| Collected | – | ~96% |
| Processed or treated | ~100,000 t/day | ~61% |
| Sent to disposal sites | ~38,000 t/day | ~22% |
| Unaccounted for | ~28,576 t/day | ~17% |
The third and fourth rows are the point. The statistical gap — roughly the volume Australia generates in total in a single day — most likely ends up in open dumps or is burned. This is not measurement imprecision but a structural deficiency in the record-keeping system: most Indian urban local bodies (ULBs) maintain no long-term dataset on annual waste volumes deposited at disposal sites.
The official per-capita generation rate is 0.12 kg/day — a figure the report itself flags as underestimated. For its scenario modelling the authors instead use settlement-size-based rates from CPCB (2000) and Annepu (2012): 0.55 kg/capita/day in cities above two million inhabitants. The gap between the two illustrates just how uncertain the activity data underpinning the entire national emissions calculation actually is.
The trend, however, is unambiguous. NITI Aayog projects that today’s 62 million tonnes per year will reach 165 million by 2030 and 436 million by 2050. India is currently the world’s seventh-largest waste generator and third among G20 nations.
The inheritance: 2,474 dumpsites and 270 million tonnes
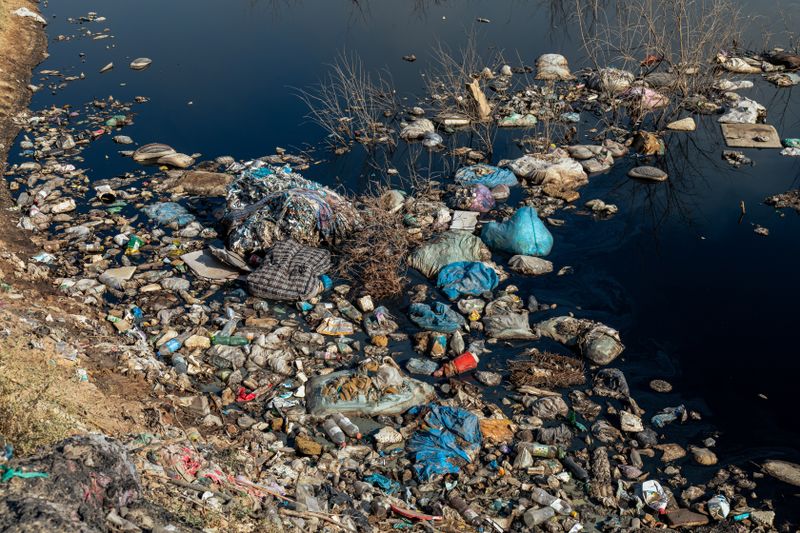
The report’s strongest chapter is its accounting of legacy waste. Per CPCB 2022–23 data, India operates 2,474 active open dumpsites. Against that, 377 sites have been reclaimed or capped, and only 44 have been converted into engineered sanitary landfills — 35 of them in Punjab alone. In other words, conversion has effectively not happened anywhere else in the country.
The worst-performing states — Maharashtra, Rajasthan, Tamil Nadu and Karnataka — each reported more than 200 dumpsites.
The Swachh Bharat Mission (SBM) dashboard, as of July 2026, puts the same indicator at 2,454 active dumpsites — a similar national total but with materially different state-level distribution: for Uttar Pradesh the two sources differ by more than a factor of two, for Assam by a factor of three. The authors read this directly as evidence of inadequate data management at central government level. Anyone accustomed to reconciling divergent national statistical and environmental-registry datasets in Europe will find some perspective here.
Accumulated legacy waste stands, per SBM data from May 2026, at 2,700 lakh tonnes — 270 million tonnes — spread across more than 15,000 acres, roughly 6,070 hectares. The report’s own comparison: an area equivalent to about 8,500 FIFA-standard football pitches.
The composition of legacy waste is precisely why biomining works as a strategy in the Indian context:
- fines (40–60%): decomposed organic matter mixed with silt, sand and fine construction and demolition fragments
- combustibles (15–20%): plastics, paper, cardboard, textiles
- coarse inert fraction (~20%): broken brick, masonry, stone
- miscellaneous (1–5%): metals, glass, hazardous sharps, sanitary waste
At older sites — Delhi, Hyderabad — the fines fraction reaches 72–75%. Most of the material, in other words, is no longer waste but soil-like residue: excavatable, screenable, and the land beneath it recoverable.
The climate dimension: second only to agriculture
According to India’s First Biennial Transparency Report (BTR-1), the waste sector emitted 93.84 MtCO₂e in 2022, equal to 2.76% of the country’s total greenhouse gas emissions excluding LULUCF. The percentage looks misleadingly small — until one examines the gas composition.
The waste sector is India’s second-largest methane source after agriculture: 2,776 Gg CH₄ in 2022, plus 58.93 Gg N₂O. Roughly 14.6% of national methane emissions originate here. The Fourth Biennial Update Report (BUR-4) identified 226% growth in waste-sector emissions between 1994 and 2020; in 2020 alone, MSW at landfills generated 912 Gg of methane.
The report uses the 20-year global warming potential (GWP₂₀ = 84) as its reference metric — a deliberate methodological position rather than an incidental choice. The logic of SLCP mitigation rests precisely on the short atmospheric lifetime: the climate benefit of cutting methane materialises almost immediately. IGSD’s own research indicates that reducing non-CO₂ pollutants can avoid four times more warming by 2050 than a CO₂-only focus.
The scale of point-source emissions becomes tangible where satellite measurement exists:
- Ghazipur (Delhi): leaked an estimated 156 tonnes of methane per hour in 2021 — comparable, in the report’s framing, to the pollution from 24 million cars running simultaneously. On 22 March 2022, an estimated 2.17 tonnes in a single hour. The site covers more area than the Taj Mahal and functions as a breeding ground for both tuberculosis and dengue.
- Deonar (Mumbai): Asia’s largest dumping ground, the size of 268 football pitches, receiving 9,000 tonnes daily — with neither segregation nor processing.
- Bandhwari (Gurugram): four methane-induced fires in April 2025 alone, one lasting more than 20 hours and requiring 25 fire tenders and 40 firefighters. Fire department officials noted such incidents are not unusual during summer months.
Landfill fires carry a distinct climate risk of their own: black carbon has a warming potential of 52,000 over its roughly two-week atmospheric lifetime, while simultaneously acting as a direct air pollutant as a component of PM2.5.
Projections indicate annual greenhouse gas emissions from MSW will rise from 13.23 million tonnes in 2018 to 41.09 million tonnes by 2030 — over 210% growth in twelve years.
The six levers, and why the system doesn’t move
The study follows an “hourglass” structure: it narrows from the macro level to landfill methane, then widens back out to six intervention levers in the surrounding ecosystem — judicial practice, regulation, financing, infrastructure, technology and behaviour. The financing chapter is the most sobering.
Where the money goes
The distribution of Indian SWM expenditure:
- 50–70% street sweeping and collection
- 20–30% transportation
- less than 5% processing and final disposal
This single ratio explains most of the other problems. ULBs can cover on average only about half of necessary SWM expenditure; the share of municipal budget allocated to SWM ranges from 5% to 40%, reaching up to 70% in smaller towns. Per-capita expenditure runs at INR 50–250, higher in metros (Chennai INR 295, Mumbai INR 428, Delhi INR 431). CPHEEO estimates full-service costs at INR 500–1,500 per tonne.
Central funding is not the constraint: the FY 2025–26 budget allocated ₹5,000 crore to SBM-Urban and ₹7,192 crore to SBM-Grameen — 9.3% and 9.6% respectively of the two relevant ministries’ budgets. The constraint is absorption. Audits by the Comptroller and Auditor General (CAG) produced figures that verge on the absurd:
- Kerala: against a mandatory 10–15% allocation of the General Development Fund, the ULBs audited spent 0.48–1.66% on waste management between 2016 and 2021. Each year, between one and six ULBs recorded zero allocation.
- Maharashtra: of ₹18,732 crore spent between 2016–17 and 2021–22, ₹16,148 crore (86%) went to revenue expenditure — day-to-day collection and transport — and only ₹2,584 crore (14%) to capital expenditure.
- Jharkhand: SWM accounted for just 2–11% of total expenditure between 2017 and 2022; thirteen and six ULBs respectively spent nothing at all from 14th and 15th Finance Commission grants despite funds being available. Unspent shares ranged from 74% to 100%.
The L1 trap
The second finding, central from a technology-policy standpoint, concerns procurement. India’s public procurement system accounts for 20–22% of GDP and defaults to awarding contracts to the lowest-cost bidder (the L1 method). A budget-constrained municipality plus lowest-price selection equals manual collection and unsanitary dumping, regardless of what technology is available.
Quality- and Cost-Based Selection (QCBS) is intended to change this. The report cites the World Bank-supported Kerala Solid Waste Management Project, where the winning bid of ₹3.2 crore substantially exceeded a competing ₹1.9 crore offer yet prevailed on technical qualification. Uptake, however, remains uneven: procuring agencies revert to L1 for want of training and clear operational guidance, and out of concern over subjective technical scoring.
Technology assessment: the report says out loud what Europe tends to circle around
Table 26 is the most contestable and simultaneously the most honest part of the analysis, because it is not a neutral technology survey but a ranking.
Incineration / waste-to-energy — “least preferred option.” The authors’ case: poor alignment with circular economy principles, destruction of recoverable material value, consistent underperformance on India’s low-calorific, high-moisture waste, toxic ash and dioxins, repeated financial and operational failures, and strong public opposition. India’s WtE fleet currently comprises 22 plants (including biogas facilities) with roughly 207 MW installed capacity and 17,600 t/day treatment capacity. The recommendation: keep it marginal, restricted to dense metropolitan settings under strict oversight. The report notes that some Delhi WtE plants have exceeded legal dioxin emission limits.
Biomining + biocapping — “the most circular-economy-aligned and policy-backed approach.” Actively mandated by the NGT, SBM-U 2.0 and the SWM Rules 2026, with demonstrated success in Indian cities (Indore). The recommendation: this should remain the primary national strategy for dumpsite remediation. At Rajkot, the Nakrawadi site’s 1.6 million tonnes were processed through biomining, separating RDF for WtE, semi-compost for land enrichment and inert material for secured landfill — the site became a 20-acre urban forest.
Landfill gas (LFG) capture — “promising but conditional.” Viable only at engineered sites with high organic content. Few Indian pilots, mixed outcomes — the Ghazipur project failed on funding. High CAPEX and O&M costs, weak regulatory mandate. Not scalable across thousands of open dumps.
Biocovers / methane oxidation layers — “supplementary option.” Not recognised in the SWM Rules, SBM-U or NGT guidelines. No material recovery, purely end-of-pipe emission control; requires specific soil-compost mixtures and continuous upkeep; only academic pilots exist in India, with no municipal-scale adoption. The authors make a pointed observation: methane oxidation layers should not be procured as a standalone technology category but integrated into landfill closure and remediation design specifications — which in turn requires explicit technical standards that currently do not exist.
This ranking deserves a pause. In a country carrying a 270-million-tonne disposal legacy, the report places waste mining and segregation first, not incineration — and pushes incineration explicitly to the bottom of the hierarchy. The logic is essentially identical to the EU waste hierarchy, except that in India it was arrived at not through three decades of legal development but through the empirical evidence of a decade of failures.
The 2026 regulatory turn — and the contradiction inside it
The timing of the analysis is not incidental. India’s waste regulation entered a new regime in 2026:
Solid Waste Management Rules, 2026 — notified 28 January 2026, in force from 1 April 2026, superseding the 2016 Rules. Principal elements:
- mandatory four-stream segregation at source (wet, dry, sanitary, special-care)
- an Extended Bulk Waste Generator Responsibility (EBWGR) framework for large generators (floor area ≥20,000 m² or output ≥100 kg/day)
- a centralised digital monitoring portal, with environmental compensation for false reporting
- a phased RDF substitution mandate for cement and WtE industries: 6% at implementation, rising to 15% within six years
- landfill restriction: only non-recyclable, non-recoverable and inert waste may be landfilled
- environmental compensation on polluter-pays principles
- time-bound legacy dumpsite remediation, with quarterly progress reporting
Two further elements underpin institutional delivery. The Dumpsite Remediation Accelerator Programme (DRAP), launched in November 2025, targets the 214 highest-impact dumpsites across 202 ULBs — together holding roughly 80% of India’s remaining legacy waste, some 88 million tonnes — backed by central financial assistance of ₹550 per tonne, digital monitoring, and a “5-P” framework (political leadership, public finance, partnerships, project management, public advocacy). The Supreme Court of India, in orders of 29 April and 5 May 2026 (C.A. No. 6174/2023), directed District Collectors to constitute Special Cells for implementation oversight with fortnightly compliance reporting. The report characterises this as a decisive shift from aspirational policy to immediately enforceable obligation.
Here comes the report’s sharpest regulatory critique. Schedule II of the SWM Rules 2026 mandates installation of landfill gas control and collection systems at all new landfills and prohibits passive methane escape. The same instrument, however, mandates four-stream segregation, whose logical consequence is that over time only inert residue reaches landfills — producing negligible gas. The authors describe this as an “internal contradiction” requiring regulatory clarification: how should gas capture infrastructure be sized, sequenced and financed for a waste stream whose contraction is itself the objective of the regulation?
The proposed resolution is pragmatic. CPCB guidance should clarify that gas recovery provisions apply primarily to legacy capped dumps and transitional landfills receiving mixed waste, not to new facilities receiving only inert residuals; and investment decisions should be site-specific and modularly scalable rather than fixed and large-scale. This is precisely the kind of consideration that will inevitably surface in reconciling EU landfill and methane regulation.
The measurement problem: a 60-fold spread
One of the analysis’s most important — and professionally most unsettling — findings is methodological. Methane emission estimates for the same landfill site vary by up to sixty-fold depending on whether satellite remote sensing, the IPCC first-order decay model, or direct flux chamber measurement is used. IPCC default models are calibrated to US and European waste compositions, and in the authors’ assessment are not valid for Indian conditions.
The recommendation is unambiguous: CPCB should develop India-specific emission factors — calibrated to domestic waste compositions, moisture content and temperature profiles — and these should replace IPCC defaults for compliance reporting under the SWM Rules 2026. TCLP testing of biomining output fractions should be replaced by WELT-equivalent protocols, with a mandatory 24-month transition timeline.
Until that happens, the scenario analysis itself is of limited validity — something the authors state explicitly, to the study’s credit.
The four scenarios: 2019–2047
The modelling rests on the IPCC Tier 1 methodology (2006 Guidelines, Volume 5, Chapter 3, with the 2019 Refinement). Several key parameters are worth flagging for a European technical readership:
- DOCf = 0.77 — substantially above temperate-zone values, justified by an average Indian landfill temperature of roughly 35 °C
- MCF = 0.4, held constant
- F = 0.5 (IPCC default)
- OX = 0 — the model assumes zero methane oxidation in cover soils
- landfill share: CPCB data for 2017–2023, then an assumed policy-driven, ambitious decline to 15% by 2047
| Scenario | Focus | Reduction, 5 yrs | 10–15 yrs | By 2047 |
|---|---|---|---|---|
| BAU | incremental improvement | ~10% | ~35% | ~52% |
| ALT 1 | legacy remediation + LFG capture | ~85% | ~95% | ~94% |
| ALT 2 | value chain optimisation, 100% segregation | ~17% | ~73% | ~90% |
| ALT 3 | integrated (ALT 1 + ALT 2) | ~90% | ~99% | ~100% |
The shape of the trajectories is at least as informative as the endpoints:
BAU: emissions hold steady at around 1,200–1,300 kT/year through 2025, then decline slowly. By 2047 they still stand at roughly 600 kT/year — meaning the current pathway, characterised by partial compliance and weak enforcement, does not even reach a halving within the model horizon.
ALT 1: a steep drop between 2025 and 2030 (biomining, biocapping, gas recovery), followed by a plateau. This is the report’s key finding: absent systemic reform after the legacy stock is addressed, the curve flattens, because fresh waste continuously regenerates the problem.
ALT 2: a slower but persistent decline from 2025 through 2045, driven by nationwide segregation and diversion systems. Durable mitigation with broader socio-economic co-benefits — but legacy emissions remain untouched.
ALT 3: parallel implementation of both pathways. The fastest and deepest reduction, approaching zero by 2030 in the model and holding at minimal levels through 2047.
The spatial analysis confirms hotspot concentration. A per-pixel trend analysis on the EDGAR v8.1 dataset, filtered with Benjamini–Hochberg FDR correction at α = 0.01, identifies persistent methane hotspots around Delhi, Mumbai, Bengaluru, Chennai and Hyderabad, with decadal-scale structural emission growth across western India, the Indo-Gangetic plains and parts of the south.
The economic reading
The report does not stop at emissions. It estimates the circular economy potential of India’s waste sector at more than USD 15 billion annually. The country’s solid waste disposal sites (SWDS) could underpin 5,167 to 14,355 MW of generating capacity; landfill gas capture can cut site-level methane emissions by 60–90%. SBM-U 2.0 has allocated ₹776 crore specifically for bioremediation and land reclamation.
Indore serves as the reference model. The GOBARdhan bio-CNG plant, built on a 20-year BOOT/PPP structure at a cost of ₹150 crore (with ₹10 crore in viability gap funding), processes up to 550 tonnes per day of segregated wet waste, producing around 17 tonnes of bio-CNG daily alongside 100 tonnes of compost and liquid fertiliser. The municipality committed to purchasing at least half the output — as fuel for city buses. Municipal revenues include ₹2.52 crore annually in land premium, ₹1.43 crore in dry-waste royalties, and roughly ₹9 crore in carbon credit earnings over two years. More than 90% of households segregate, and the processing facility handles 1,000 tonnes daily at a 95% recovery rate.
The ITC-led “four-P” (public-private-people) model in Saharanpur illustrates a different scale: 18,000 households across 30 wards, more than 90% of waste diverted from landfill, over 350 tonnes of compost produced annually, 70% average cost recovery between 2012 and 2015, and a fee collection rate exceeding 91% — dramatically better than Indian averages.
What is worth taking away
India has not signed the Global Methane Pledge; it approaches methane mitigation through sectoral interventions nested under its NDCs. The analysis is an attempt to underpin exactly that strategy with data — building the case on domestic cost-benefit logic rather than international commitment.
Three findings deserve European attention.
First, investment structure. The pattern in which 50–70% of waste management expenditure goes to collection and under 5% to treatment is not an Indian peculiarity but the base risk of any collection-centric, concession-based system. Where service fees are tied to tonnes collected, treatment capacity development remains structurally underfunded — even where regulation formally requires it.
Second, the primacy of monitoring. EU Regulation 2024/1787 on methane covers the energy sector; landfill methane measurement in Europe remains far less developed than the Landfill Directive’s 10% target for 2035 would demand. A sixty-fold estimation spread is not an Indian problem — it is merely more conspicuous in India because the magnitudes are larger. The lesson the report draws explicitly: without site-specific emission factors calibrated to domestic waste composition, compliance reporting is not in itself an outcome.
Third, regulatory coherence. The contradiction exposed in the SWM Rules 2026 — mandatory gas capture applied to a deliberately shrinking waste stream — is precisely the conflict that arises in any legal system where landfill restriction and landfill emission control develop in parallel but without coordination. The resolution will be the same there as here: differentiation between legacy dumps, transitional mixed-waste sites and new inert-residual facilities, and modular, decommissionable gas infrastructure in place of fixed large-scale investment.
The report’s closing conclusion, however, is not technological. Waste-sector methane mitigation in India, the authors argue, is “technically feasible, economically viable and institutionally achievable within the current decade” — but this requires a shift from fragmented, project-based approaches to a coordinated, system-level response that prioritises hotspot cities, aligns financing with methane outcomes, and embeds waste-sector methane within the country’s broader SLCP strategy.
ALT 1 and ALT 2 each signal failure in isolation: one loses momentum after 2030, the other starts too slowly. The lesson is that managing the legacy and managing the future waste stream are not alternatives but two halves of a single task — from which it follows that sequential scheduling (first fix the dumpsites, then the value chain) does not work arithmetically. That is the sentence one has to work through 192 pages of modelling to believe.
Citation:
Srivastava, S., Chowdhary, P., & Bakshi, R. (2026). Municipal Solid Waste Management in India: Policy and Technology Pathways for Climate Action. Gateway Research and Institute for Governance & Sustainable Development (IGSD)