


If you like our site, mark us as a preferred source on Google — so you’ll see our articles more often in search!
★Mark us as a preferred sourceTurkey’s domestic plastic waste generation has fallen in recent years, while its imports have grown 31.6-fold since 2005. The Zero Waste Foundation’s new report, built on international datasets and national indicators, maps both the structure of the global plastics crisis and a rarely examined asymmetry: how an upper-middle-income country became the European Union’s single most important waste export destination. The most revealing part of the document, however, is not the headline figure but a statistical contradiction that calls the entire recycling performance narrative into question.
The Plastik Atık Raporu published by the Data Center of Turkey’s Zero Waste Foundation (Sıfır Atık Vakfı) is a situation assessment built on international databases – OECD, Plastics Europe, UN Comtrade, UNCTADstat, World Bank – and peer-reviewed literature. Its structure is twofold: it first maps global plastic flows, then places Turkey’s position within that frame. The analysis below follows the same logic, but shifts the emphasis to the chapter that matters most from a Hungarian and EU perspective: international waste trade.
The global frame: production is not slowing
The report’s starting point is that growth in plastic production is structural rather than cyclical. Output rose from 213 million tonnes in 2000 to roughly 460 million tonnes by 2019 – more than 115 percent growth in two decades. Apart from a temporary contraction linked to the 2008–2009 crisis, the curve rises without interruption.
The Foundation’s Data Center ran two modelling approaches – Holt trend estimation and polynomial fitting – on the OECD (2022) series. Both point in the same direction: average annual expansion of roughly 13 million tonnes, and a global production volume of 537–550 million tonnes by 2025. The report concludes that the half-billion-tonne threshold will be permanently crossed in the short term.
Plastics Europe’s actual figures confirm this trajectory: after 380 million tonnes in 2020, global production reached 394 million tonnes in 2021, 400.4 in 2022, 413.8 in 2023 and 430.9 million tonnes in 2024.
The geographic concentration of production matters just as much. Roughly 51 percent of global capacity sits in Asia, with China alone accounting for 31 percent and other Asian countries a further 20 percent. North America’s NAFTA bloc represents 19 percent and Europe 16 percent; the Middle East and Africa account for 7 percent, Latin America 4 percent and the Commonwealth of Independent States 3 percent. Raw material processing and manufacturing infrastructure has shifted decisively eastward – a fact that also determines the later carbon border chapter.
Waste generation and the dominance of packaging
Waste-side data follow a parallel path: global plastic waste generation grew from 156 million tonnes in 2000 to 353 million tonnes in 2019. Packaging accounts for 31 percent of plastic use but already 40 percent of the waste generated – the characteristic distortion of short-lifespan product categories, familiar to anyone following the PPWR debates.
The 2019 treatment shares are sobering: 9 percent recycling, 19 percent incineration, 50 percent sanitary landfill, and 22 percent uncontrolled storage, open burning or environmental leakage. In the same year 22 million tonnes of plastic entered the environment, of which 6.1 million tonnes reached rivers, lakes and oceans.
The report also presents a 2024 estimate under which 23 percent of global plastic waste – around 100.1 million tonnes – remains outside any management system. Of this, 23.2 million tonnes leaks into the environment, 7.3 million tonnes reaches rivers and coastlines, and approximately 2.1 million tonnes, some 0.5 percent of the total, ends up in the oceans.
Methodological note. In this figure the report labels the 430.9 million tonne value as “plastic waste produced,” although this is in fact the Plastics Europe production figure for 2024. Conflating waste generation with production also affects the derived ratios (77/23 percent), so these values should be treated as order-of-magnitude estimates rather than a precise mass balance.
Leakage is not a function of wealth
One of the report’s strongest analytical contributions is the separation of generation from leakage. These are two distinct indicators: per capita plastic waste generation measures annual volume, while per capita plastic pollution measures how much of that volume actually enters the environment uncontrolled. Their ratio – termed the leakage-to-generation ratio in the report – is effectively a measure of collection, processing and disposal chain capacity.
| Income group | Per capita generation (kg/yr) | Per capita pollution (kg/yr) | Leakage/generation ratio |
|---|---|---|---|
| Low income | 15.97 | 10.24 | 64.1% |
| Lower-middle income | 24.22 | 9.57 | 39.5% |
| Upper-middle income | 35.11 | 5.19 | 14.8% |
| High income | 62.72 | 0.13 | 0.2% |
| World average | 33.12 | 6.65 | 20.1% |
Source: Zero Waste Foundation Data Center, based on Cottom et al. (2024)
The extremes are equally telling. The United Arab Emirates leads per capita generation at 111.07 kg annually, followed by Brunei (98.09), Hong Kong (91.43) and Aruba (90.22) – all high-income economies without exception. In actual pollution, however, Cambodia tops the list at 25.24 kg, followed by Paraguay (23.35), Equatorial Guinea (20.78), South Sudan (20.37) and Haiti (20.33). The lowest pollution values are recorded in Gibraltar and Singapore (0.030 kg), followed by Macao, Bahrain and Monaco.
The report correctly flags the interpretive limit here: the low pollution figures of high-income countries stem partly from advanced treatment infrastructure, but partly from the fact that they export their waste to developing countries for processing. That sentence effectively anticipates the central claim of the report’s trade chapter.
Turkey’s position in the rankings
Turkey falls into the upper-middle-income category, with per capita plastic waste generation of 48.00 kg/year and pollution of 5.79 kg/year. Generation exceeds the world average by 44.9 percent (+14.87 kg) and its own income group average by 36.7 percent (+12.89 kg). Pollution, by contrast, sits 13 percent below the world average (−0.86 kg), while exceeding the upper-middle group average by 11.6 percent (+0.60 kg).
In ranking terms, Turkey places 84th of 216 countries and regions for generation and 122nd for pollution; within its own income group it ranks 9th of 57 for generation but 47th for pollution. The picture is therefore dual: the existing waste management system keeps environmental leakage below the global average, yet relative to comparably developed countries, significant gaps persist in collection, sorting and disposal.
Where does the plastic leak from?
The report breaks leakage down into five terrestrial channels: uncollected waste, littering, collection and transport losses, unregulated (wild) dumping, and residues from recovery facilities.
For Turkey, of the 5.79 kg total, 5.01 kg – more than 86 percent – originates from uncollected waste. Waste disposal facilities contribute 0.40 kg, littering 0.18 kg, collection and transport 0.13 kg, and sorting residues around 0.07 kg.
This breakdown matters for policy because it identifies the intervention point unambiguously: the bulk of Turkish pollution is not a technology problem but a coverage problem. The same structure holds for the world average (4.59 kg of the 6.65 kg total from uncollected waste), and will be familiar to anyone who has examined Hungarian public service coverage data in recent years.
The report also flags the boundaries of the dataset: the breakdown covers only macroplastics larger than 5 millimetres, and counts only household and similar terrestrial municipal solid waste. Industrial plastic and textile manufacturing, waste from maritime activities (fishing gear, for example), electronic waste, and plastics that disappear across borders following export all fall outside the dataset.
Rivers: Turkey ranks 11th
According to the dataset of Meijer et al. (2021), covering 163 countries, roughly 979,458 tonnes of plastic reached the oceans via river systems in 2019. The per-country mean is 6,008 tonnes, but the median is only 235 tonnes – a gap that illustrates how riverine leakage concentrates in a handful of countries.
Approximately 70 percent of global riverine plastic discharge originates in five Asian countries: the Philippines alone accounts for 36.4 percent of the global total at 356,371 tonnes annually, followed by India (126,513), Malaysia (73,098), China (70,707) and Indonesia (56,333). Outside Asia, Brazil is the largest emitter at 37,799 tonnes.
Turkey ranks 11th at 14,300 tonnes annually – more than double the global mean. For comparison: riverine discharge is 2,430 tonnes for the United States, 1,835 for Japan, 703 for the United Kingdom and 134 tonnes for Germany.
The report inserts a methodological caution here as well. Two structural factors may explain extremely low values: geographic constraints (rivers in landlocked countries do not reach the ocean directly within national borders) and advanced waste management infrastructure. Riverine discharge alone is therefore not an indicator of national waste management performance.
The document also presents the Turkish situation at basin level, mapping estimated annual plastic emissions at river mouths in the Istanbul, Adana–Hatay and Antalya catchments. Some outlets in the Istanbul basin show estimated annual values above 1.5 million kilograms, reflecting the combined effect of urban density and catchment-level collection gaps.
The turning point: the end of the export era
This is where the report becomes genuinely relevant for Hungarian and EU readers. It analyses per capita plastic waste export data from 1988 to 2024 and documents a structural transformation of global waste trade.
The growth phase peaked around 2010, when per capita exports from high-income countries exceeded 12 kg per person. Following the 2016 Asian import restrictions – above all China’s tightening – the trend broke. High-income country exports fell from 8.41 kg/person in 2016 to 2.02 kg/person in 2024: a decline of more than 75 percent. For the EU-27 the drop was from 9.12 to 4.21 kg/person. The world average sank to 0.39 kg/person by 2024.
Turkish exports, by contrast, remained marginal throughout: after a peak of 0.22 kg/person in 2010, they fell to 0.12 kg/person by 2024. Turkey is not a source in the global waste trade network – it is a destination.
The import surge
Import data confirm this dramatically. Between 2005 and 2009, Turkish import and export volumes moved at low and comparable levels. After 2010, imports began climbing steeply: roughly 265,000 tonnes in 2017, around 440,000 tonnes in 2018, then after a 2019 dip (260,000 tonnes), a period peak of 767,000 tonnes in 2020. Imports stood at around 700,000 tonnes in 2021 and 2022, and roughly 630,000 tonnes in 2023. Exports remained between 10,000 and 39,000 tonnes throughout.
Indexed to the 2005 base year, Turkish plastic waste imports grew 31.6-fold by 2023. Over the same period the EU index stayed around 220 and the OECD index around 180, while the world and G20 indices – particularly after 2017 – fell below their 2005 baseline. Turkey’s trajectory does not merely diverge from the global trend; it runs against it.
Relative weight grew just as sharply. In 2020, Turkish plastic waste imports represented 33.6 percent of total G20 imports, roughly 29 percent of EU imports, 19 percent of OECD imports and approximately 12 percent of world imports. By 2023 these shares had partly moderated but remained high: around 10.5 percent of the world total, 23 percent of the EU, 15.5 percent of the OECD and 28 percent of the G20.
Turkey’s net trade balance in 2023 stood at +611,000 tonnes. Over the same year the European Union recorded −160,000 tonnes, the OECD −344,000 and the G20 −485,000 tonnes. On a per capita basis, Turkish import intensity peaked at 9.17 kg/person in 2020 and remained around 7.4 kg/person in 2023.
Where does it come from?
The source country breakdown shows a notable reshuffling between 2022 and 2023. The sum of identified country flows rose from 377,000 to 420,000 tonnes (+43,000 tonnes, +11.4 percent).
The largest change came from the United Kingdom: exports to Turkey nearly doubled from 71,000 tonnes in 2022 to 141,000 tonnes in 2023, making the UK the single largest source country. Germany declined from 92,000 to 88,000 tonnes, while Italy more than doubled from 19,000 to 42,000 tonnes. Belgium (44 → 39), Spain (37 → 32), the Netherlands (38 → 27), Slovenia (27 → 9) and the United States (12 → 7) all declined, while Romania (11 → 14) and Portugal (2 → 3) rose modestly.
The picture is unambiguous: Turkey primarily receives European plastic waste, and a substantial share of post-Brexit British waste flows is directed there as well.
The report’s central contradiction
Citing OECD (2024) data, the report states that plastic waste generation in Turkey was around 0.76 million tonnes (757,343 tonnes) in 2020, falling to 0.60 million tonnes (600,041 tonnes) by 2022. In EU member states, by contrast, generation rose from 18.95 to 20.29 million tonnes (+7.1 percent).
The volume of plastic waste recycled domestically in Turkey fell by 25.5 percent over the same period: from 3.02 million tonnes to 2.25 million tonnes. In the EU it rose from 8.11 to 9.37 million tonnes (+15.5 percent).
This is the report’s most revealing data point, and one it does not separately comment on. According to the 2022 Turkish figures, the volume recycled domestically (2.25 million tonnes) is almost four times domestic generation (0.60 million tonnes). The gap cannot be explained by imports alone: 2022 imports were on the order of 700,000 tonnes, which even combined with domestic generation falls well short of the reported recycling volume.
It follows that either the generation figure is underestimated – a realistic possibility, since the OECD projection is a modelled rather than measured value – or the recycling statistic includes material flows (industrial production scrap, or material counted at multiple stages) that do not appear in the generation figure. Whichever explanation holds, the conclusion is the same: Turkish recycling ratios are not currently directly comparable to EU member state data, and are not suitable on their own as a performance measure.
Energy recovery data are similarly incomplete: EU volumes fell from 2.64 to 2.49 million tonnes, while for Turkey only the 2020 value of roughly 4,100 tonnes is available, with no 2022 figure reported.
The report’s own caveats
The document warns against simplistic readings in several information boxes, and this professional caution is one of its strengths.
It stresses that clean, well-sorted, low-contamination waste can genuinely function as an economic input, provided the receiving facility has adequate technical capacity, environmental permits and secondary raw material demand. Life cycle assessments indicate that mechanical recycling delivers environmental advantages over primary plastic production in many scenarios – but the outcome depends on waste quality, energy source, process efficiency, substitution rate and the management of residues.
The report also outlines Turkey’s regulatory framework under Environmental Law No. 2872. Import of certain non-hazardous wastes with economic value is permitted for recycling purposes; import of hazardous, non-recoverable and disposal-destined waste is prohibited. Implementation rests on the Ministry of Trade’s annually published import inspection communiqué and the Ministry of Environment, Urbanisation and Climate Change’s waste import implementation circular. Imports are permitted only for recovery facilities holding a Waste Importer Registration Certificate together with either a Temporary Activity Certificate or an Environmental Permit and Licence. Shipments entering the customs territory undergo physical and compliance inspection by provincial directorate staff; non-compliant consignments are returned to origin or transited to a third country.
The report further cites Li et al. (2024) in Nature Communications, which estimates on the basis of 22 major importing countries that at least 63 percent of imported plastic waste would need to be genuinely recycled for the operation to break even economically. The document explicitly notes that this is an economic threshold estimate, not an observed performance figure.
Finally, referencing modelling by Bishop, Styles and Lens (2020), it observes that in European polyethylene waste trade even flows formally registered as recycling may carry environmental leakage risk when the final processing method is unknown. It links this to the Adana field study by Gündoğdu and Avcıoğlu (2026), which identified local microplastic contamination in irrigation canals associated with irregular discharges from certain recycling facilities – while stressing that this finding cannot be generalised to all Turkish imports.
Carbon border adjustment: the next layer of risk
The report devotes a separate chapter to the EU Carbon Border Adjustment Mechanism (CBAM), which entered its definitive financial obligation phase on 1 January 2026. Iron and steel, aluminium, cement, fertilisers, electricity and hydrogen fall under its scope in the first stage, but the CBAM Regulation empowers the European Commission to bring plastic polymers and organic chemicals into the mechanism by 2030, aligned with the EU ETS.
The multi-regional input-output (MRIO) analysis by Ren et al. (2023) quantifies the potential burden. Annual carbon tariff exposure on plastic exports amounts to EUR 497.8 million based on direct emissions alone; EUR 859.1 million including electricity consumption; and EUR 1.56 billion in a scenario covering the full supply chain. Relative to export volumes to the EU, this represents an average additional tariff burden of 0.6 to 1.8 percent. The analysis projects that China and Asia-Pacific countries would bear the largest share, while the sharpest decline in profitability would fall on the Russian economy.
For actors in the plastics value chain this does not yet mean immediate tax liability, but the report rightly notes that the extension planned for 2030 opens a critical preparatory window in which technical and operational decarbonisation infrastructure must be built.
The climate footprint of plastics
According to OECD data, the full life cycle of plastics – from manufacture to disposal – generates 1.8 billion tonnes of CO₂-equivalent greenhouse gas emissions annually, representing 3.3 percent of global emissions.
The 2015–2019 breakdown shows that emissions rose across all three life cycle stages, but at different rates. Full life cycle emissions climbed from 1.66 to 1.79 billion tonnes (+7.4 percent). Production and conversion rose from 1.50 to 1.60 billion tonnes (+6.2 percent). The fastest growth, however, occurred at end of life: from 162.1 to 193.1 million tonnes, or +19.2 percent.
This shift is itself a policy signal: the climate burden of the waste treatment stage is growing faster than that of manufacturing, reflecting expanding incineration and landfill capacity alongside growing volumes escaping the system.
What the report recommends
The document identifies six priority areas forming a mutually dependent system: source reduction (curbing problematic and unnecessary plastic use, simpler and more recyclable packaging design); collection and management infrastructure (developing separate collection at source, quality recycling and safe disposal together, prioritising river catchments, coastlines and urban drainage networks); an official data system (separate, comparable publication of generation, collection, recovery, incineration, landfill, residue and environmental leakage); standardised monitoring; verifiable facilities (accreditation, certification, digital traceability, demonstrable material flow between incoming waste and outgoing secondary raw material); and targeted financing, primarily through extended producer responsibility instruments.
The report additionally sketches a conceptual model: a digital plastic recovery credit market linking global brand owners’ EPR obligations to Turkey’s Zero Waste Information System (ECBS, UATF, MoTAT), designed to finance the 60 percent recovery target set for 2035.
What this means for the EU and Hungary
Read from a Hungarian perspective, the report’s most important message is not about Turkey at all – it is about EU waste management.
Part of the EU’s recycling statistics remains export-dependent. If Turkish imports still accounted for roughly 23 percent of EU plastic waste exports in 2023, then a non-trivial slice of member state performance indicators rests on treatment capacity whose actual output EU reporting does not track. As the PPWR’s recycled content requirements approach, this question cannot remain open: verifying recycled content presupposes traceability of the chain of custody from delivered waste through to secondary raw material.
The regulatory environment shifts in 2026–2027. Under Regulation (EU) 2024/1157 on shipments of waste, exporting plastic waste to non-OECD countries becomes prohibited from 21 November 2026, and from 21 May 2027 stricter conditions apply to exports of other non-hazardous waste. Turkey is an OECD member and therefore remains a lawful destination – but the tighter control and audit requirements applying to shipments to OECD destinations place precisely the question the Turkish report itself raises at centre stage: can it actually be demonstrated that exported material is recycled? It is a realistic scenario that the non-OECD ban will redirect part of the flows currently going to Southeast Asia toward Turkey, further increasing Turkish import pressure.
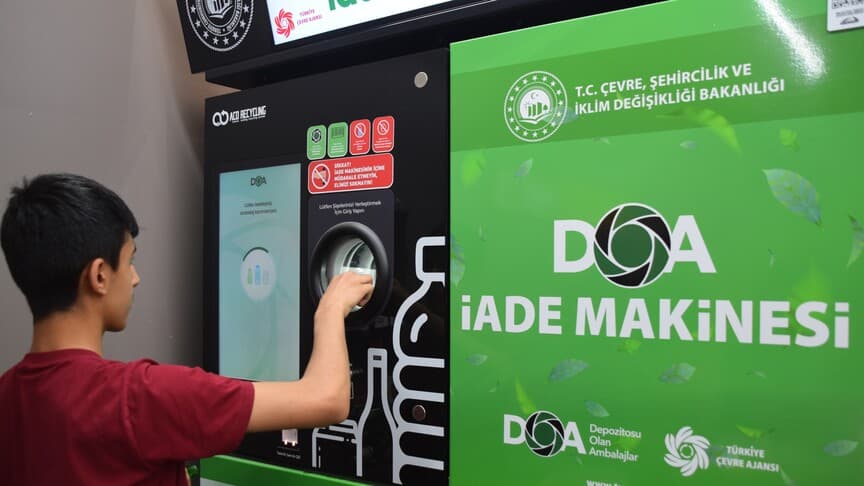
Domestic capacity building cannot be postponed. The report’s implicit lesson is that the European model, in which waste management performance is partly manufactured through export, is running out. With the infrastructure being built under the MOHU concession, the deposit return system and sorting plant capacity, Hungary faces the same question: what share of plastic flows from domestic collection genuinely becomes verifiable secondary raw material – and how much disappears at the end of the statistical chain.
Collection coverage is the bottleneck everywhere. Finally, it is worth attending to the strongest figure in the Turkish leakage breakdown: more than 86 percent of environmental leakage comes from uncollected waste, not from sorting residues or process losses. This structure appears – in differing magnitudes but similar proportions – in almost every waste management system. No technology, however expensive, improves what never enters the system in the first place.
Source:
Sıfır Atık Vakfı Veri Merkezi: Uluslararası Veriler ve Türkiye Göstergeleriyle Plastik Atık Raporu (2026). The report draws on the OECD (2022, 2023, 2024), Plastics Europe (2024, 2025), EUROSTAT, UN Comtrade, UNCTADstat, TÜİK, PAGEV and World Bank databases, as well as Cottom, Cook and Velis (2024, Nature), Meijer et al. (2021, Science Advances), Li et al. (2024, Nature Communications), Ren et al. (2023, Journal of Environmental Management), Bishop, Styles and Lens (2020, Environment International), Velis and Cook (2021, Environmental Science & Technology), Maquart, Froehlich and Boyer (2022, The Lancet Planetary Health), Gündoğdu and Avcıoğlu (2026, Environmental Monitoring and Assessment), and the UNEP (2023) technical report on chemicals in plastics.
The EU waste shipment regulation deadlines are not part of the report; they are based on Regulation (EU) 2024/1157 and appear here as editorial additions.


